TradingView India How to Use It for Stock Chart Analysis

TradingView India: How to Use It for Stock Chart Analysis

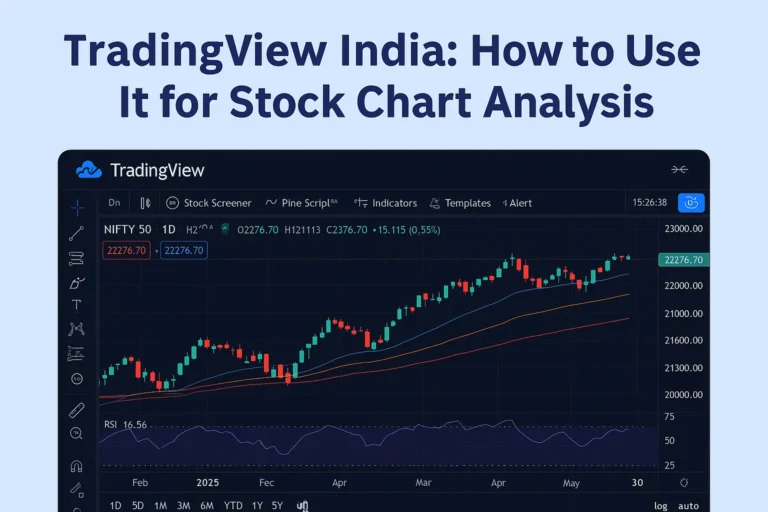
TradingView is one of the most popular charting platforms used by traders and investors around the world. For Indian stock market participants, TradingView India offers an intuitive, web-based interface to analyze charts, apply technical indicators, and track market trends in real-time. This guide explains how to effectively use TradingView India for stock chart analysis. 1….
Best Chart Patterns for Indian Stock Traders

Best Chart Patterns for Indian Stock Traders

Understanding chart patterns is essential for technical analysis in the Indian stock market. These patterns help traders identify potential price movements, reversals, or breakouts, leading to better entry and exit decisions. Whether you’re a day trader or a positional investor, mastering key patterns can improve your accuracy and confidence. Below are the most effective chart…

Common Mistakes Beginners Make When Reading Stock Charts in India

Common Mistakes Beginners Make When Reading Stock Charts in India

Reading stock charts is a fundamental skill for every trader and investor. However, beginners in the Indian stock market often make avoidable mistakes that lead to poor trade decisions. Whether you’re analyzing NIFTY stocks, intraday charts, or long-term investments, understanding what not to do is just as important as learning strategies. In this blog, we’ll…

Intraday Stock Chart Strategies for Indian Traders

Intraday Stock Chart Strategies for Indian Traders

Intraday trading in India requires precision, speed, and a solid strategy. While market noise can be overwhelming, chart-based strategies help traders focus on real-time price behavior to make accurate decisions. Whether you’re trading NIFTY 50, Bank NIFTY, or mid-cap stocks, mastering intraday stock chart strategies can significantly improve your win rate. This guide explores actionable…

RSI and MACD on Charts: Indian Market Applications

RSI and MACD on Charts: Indian Market Applications

RSI (Relative Strength Index) and MACD (MovingAverage Convergence Divergence) are two of the most widely used momentum indicators in technical analysis. When used correctly, they can help Indian traders identify overbought/oversold conditions, trend reversals, and ideal entry or exit points. This guide will show how to use RSI and MACD effectively on Indian stock charts,…

Moving Averages on Indian Stock Charts

Moving Averages on Indian Stock Charts: What You Should Know

Moving averages are among the most essential tools in technical analysis. For Indian traders, they provide a clear way to smooth out price data, identify trends, and determine potential buy or sell signals. Whether you’re trading intraday or investing for the long term, understanding how to use moving averages on Indian stock charts is critical…

What Is OHLC in Share Market Charts? Explained with Examples

What Is OHLC in Share Market Charts? Explained with Examples

When you look at a stock chart, especially candlestick or bar charts, you often come across the term OHLC. It stands for Open, High, Low, Close—the four most important data points that summarize a stock’s price movement during a specific time period. Whether you’re an intraday trader or a long-term investor in the Indian stock…

How to Read a Candlestick Chart Step-by-Step

How to Read a Candlestick Chart: Step-by-Step (Indian Stocks)

Candlestick charts are one of the most popular tools in technical analysis. Used widely in the Indian stock market, they provide a visual representation of price movements that help traders understand market sentiment, identify patterns, and time their trades more effectively. If you’re new to trading or investing in Indian stocks, this step-by-step guide will…

What Are Stock Charts? A Beginner’s Guide for Indian Traders

What Are Stock Charts? A Beginner’s Guide for Indian Traders

Stock charts are visual tools that represent the price movement of a stock over a specific period. For Indian traders and investors, these charts provide essential information to analyze trends, predict price movements, and make informed trading decisions. Whether you’re trading on NSE or BSE, understanding stock charts is the first step toward mastering the…

Support and Resistance on Stock Charts

How to Use Support and Resistance on Stock Charts

Support and resistance are two of the most important concepts in technical analysis. These levels act as psychological barriers on a stock chart, helping Indian traders decide when to enter or exit a position. Whether you’re trading intraday on NSE or investing long-term, mastering support and resistance will enhance your market timing and reduce risk….